Frequently Asked Questions:
- What is SensoReport?
- How does SensoReport work?
- How to start using SensoReport
- SensoReport (SR) website functions
- Charts
- News Feed
- News feed box icons
- Charts Page
- SR Box
- Each Post’s detail Window
- How to invite friends and add users
- Advanced Search
- Share search results and chart with public or friends
- Share on Facebook
- Share on twitter
- Android app & iOS apps
What is SensoReport?
This is an experiment:
The main goal is to rate the content on the Internet using tags. You archive and organize your online/offline content and status while all the content is in motion on wave-like charts as we all
share.
The idea in its extreme has been linked both to the recent Quantified-Self movement and Laplace’s causal or scientific determinism.
You create a tag, attach your content on it and follow others' tags. As we digitize more content and the pile of data grows ever larger, we need a way to sort the data faster and easier at the age of abundance.
Here is my music chart:
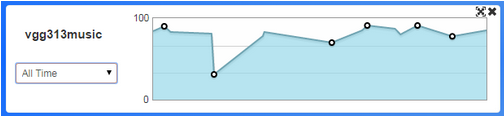
Designed as a crowd-sourced content rating platform, users can post their ratings between 0-100 - very much like 1-10 rating scale - and follow their favorite experts' posts and ratings. One may take the idea to its extreme and use this tool for voting purposes or any application that requires crowd's non-binary feedback. Regardless, the users can independently elect to modify their news feed's algorithm to match their interests(Check the advanced settings tool under the News Feed below).
And here is a quick introduction of the website by an Elephant :)
How it works from sensoReport on Vimeo.
Twitter: @SensoReportContent contained is licensed under a Creative Commons Attribution ShareAlike 3.0 Unported License
How does SensoReport work?
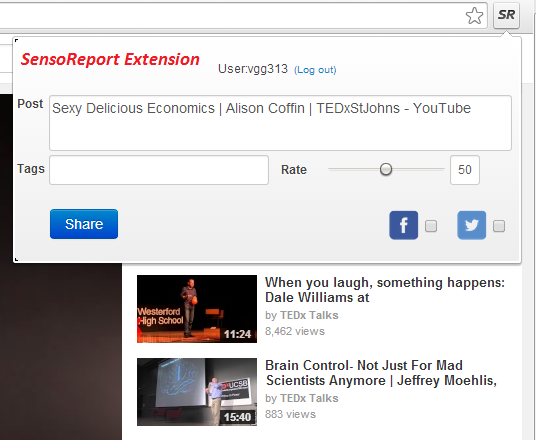
Users can rate and share anything they read or watch online through SR extension while they have the option to share them on Facebook or Twitter.
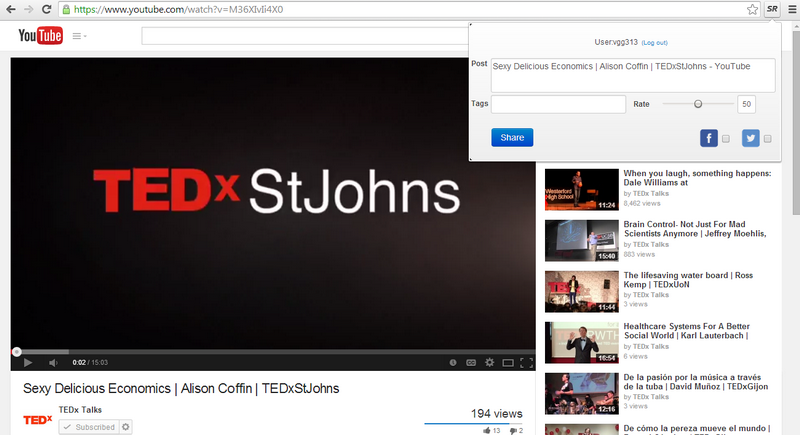
Download SensoReport extension via the link on the website and rate, share and tag whatever it’s on your browser. (Works on both Chrome and Mozilla)
Through SensoReport news feed, users can also see what other people rate in addition to see your friends’ moods and status updates on simple but meaningful charts.
Here are some examples:
Combining articles, videos and text and adding tags or ratings one can organize their private life events, work and anything around them.
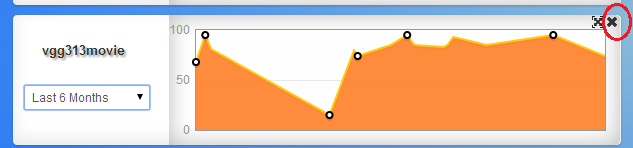
Below is the chart of the movies I have watched in the past year or so:
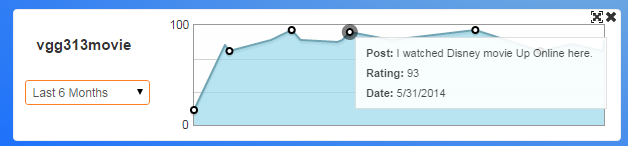
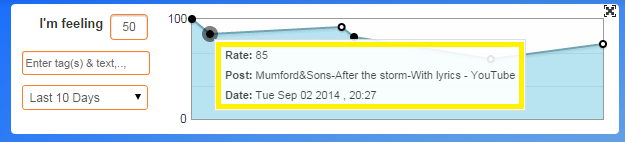
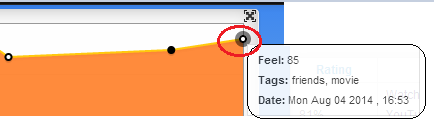
If I (or people in my network) move the cursor on any of the white dots they can see what I have liked or disliked.
How to start using SensoReport
1) Watch the “How it works Video” first.
https://vimeo.com/How it Works
2) Download the extension on Chrome or Mozilla through the link on top right.

3) Click on the SR extension on any page you have open on your browser, rate and post that page or video with your friends on SR news feed, Twitter and Facebook.
4) Visit the website and see your friends’ and public ratings and sort those using tags or their ratings.
SensoReport (SR) website functions
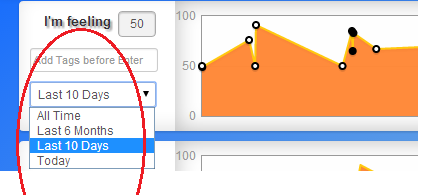
How to post a mood on your “I am feeling” chart:
1) Go to the “Add Tags before Enter” box:
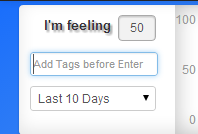
2) Use a tag(s) or express what you are up to:
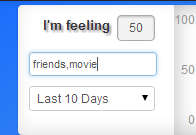
3) Enter a number between 0-100 [zero being the lowest mood and 100 the highest] and press the “Enter”:
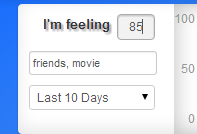
And below is the result on the chart:
OR
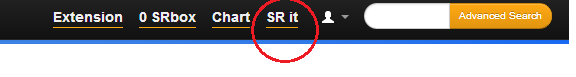
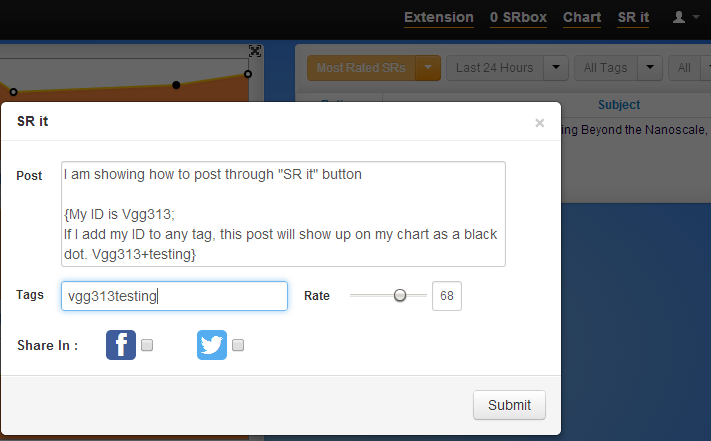
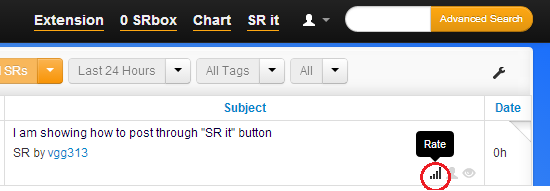
Click on the “SR it” link on the website;
Enter your post (SR) similar to a status update on FB or a tweet on twitter. Add your [ “user ID” + tag(s) ] and the post will automatically be on the chart. If you only use tag(s) without your user name it will only be posted on the news feed and not the chart.
And the result on the chart:
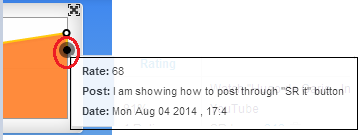
In general, any SR post with [ “user ID” + tag(s) ] will be on user’s chart.
Charts
On any chart there are black and white dots.
The white dots are users’ moods showing a rating with its tag(s).
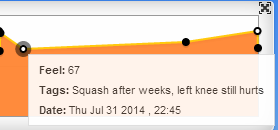
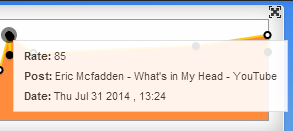
The black dots are posts with [ “user ID” + tag(s) ] and you can click on them to see the post details.
You can change the time range on the chats to see a day, 10-day, 6-month or all time period on the chart.
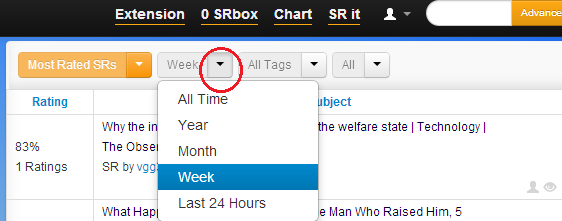
News Feed
Users can sort and filter the news feed based on the time and tags. For instance if you want to see the top rating post about movies in the past week, you can change the default time period into “week” and add “movie” tag and filter the rest of the feeds.
There is an advanced settings tool (You can skip this if you are a new user) on the top-right side of the news feed on which you can click and personalize your news feed. The default setting is to provide users with 40% agree and disagree post with 20% neutral. Agree in this context means, you have rated certain tags above public’s average.
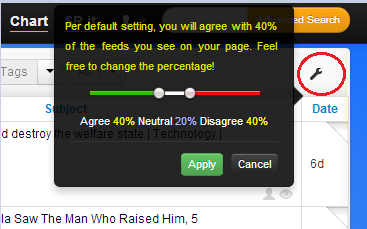
So, if you have rated “government” tag on average below the public then posts including government tag are considered to be you disagree portion of your news feed. If you want to exclude the post you typically disagree with you should adjust the disagreement bar to reflect that. Or, if you wish to read post that you typically disagree with then you need to increase the disagreement bar (red line).
Although this mechanism is still improving, the ultimate goal will be to let users personalize their news feed instead of having Google, Facebook or Twitter does this on their behalf.
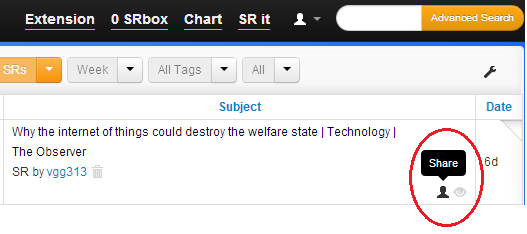
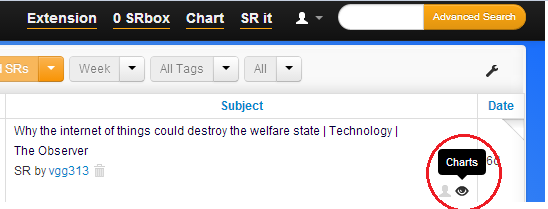
News feed box icons
Users can also share the posts, rate or see their quick charts through the icons on the right side of each post section.
Charts Page
User can define and create new charts per tags they are interested in very similar to stock indices. For example, if you wish to follow a certain tags like “worldcup” and see the top posts about worldcup you can create “worldcup” tag or your favorite scientist “RichardDawkins” and follow the posts with their tags live on a chart.
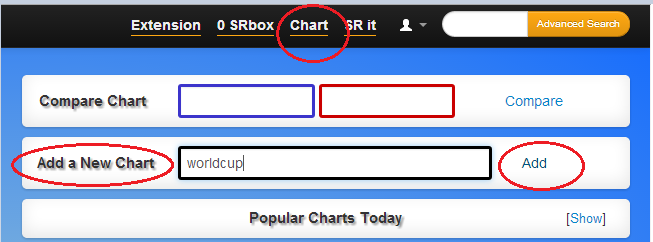
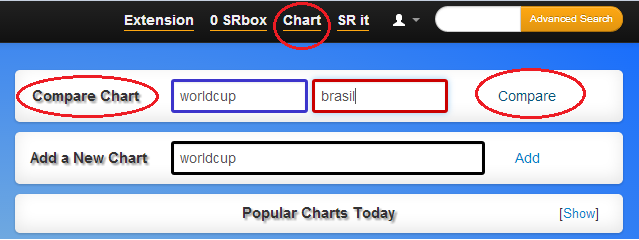
You can also compare two charts and tags.
What happens if you close a chart? You can always add the same chart again by using add a new chart option.
SR Box

SR Box works as your inbox and you can find posts that people in your network share with you or mainly want to get your feedback on them. Let’s say you watch a video and want to get your friend’s opinion on it. Share the post with your friend and it will show up on his or her SR Box.
If they rate if you can see that on the “Rated By x Friends” window.
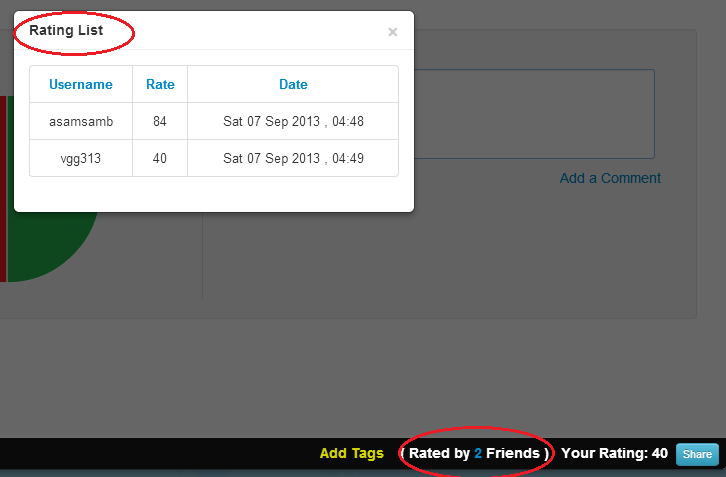
Each Post’s detail Window
By clicking on each post on the news feed you will open a window showing details about each post.
- You can find the tags for that post, add your own tags if you wish by clicking “Add Tags”
- See your rating
- And who has rated the same post with their rating
- You can also share the post via the “Share” button the right side.
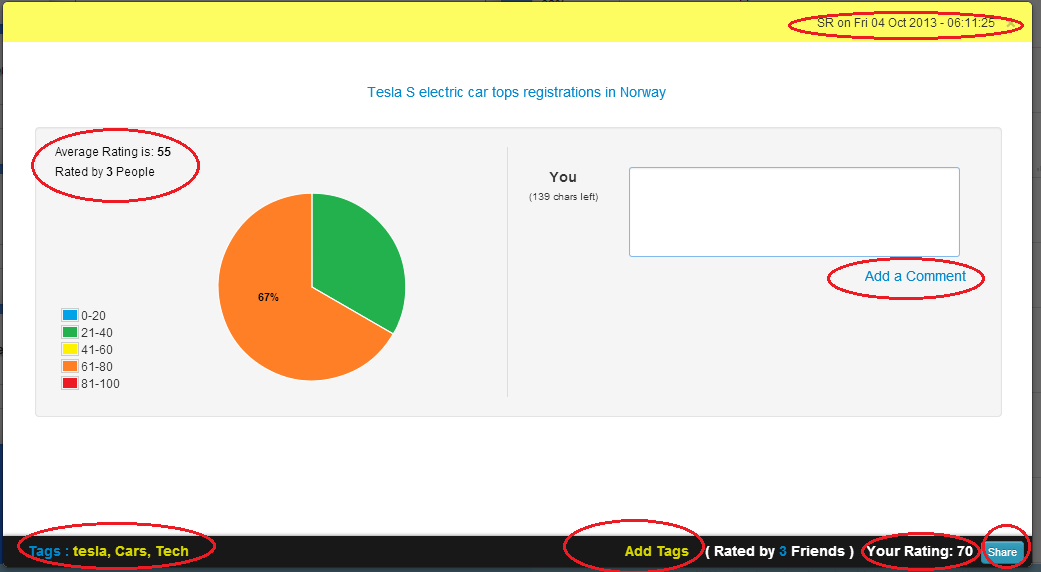
You need to scroll down to find the rating distribution of each post on a pie chart, average rating and number of people who have rated that post on the left side. By clicking on user icon:
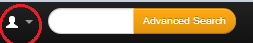
You can:
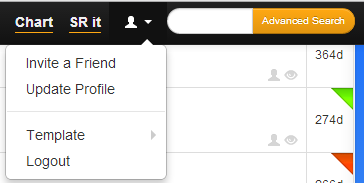
- Invite friends
- Update your profile info and photo
- Change the template to “Advanced” which shows both your network and general public ratings feed in parallel.
- Logout
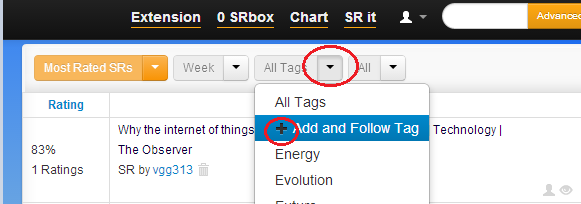
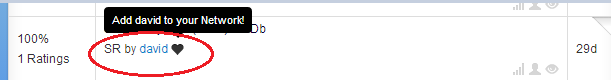
How to invite friends and add users
You can add new users either by inviting them via email or click on the hearth symbol on the news feed to add your favorite users.
Advanced Search

On advanced search you can search posts per their tag, user ID of who posted and/or rated and also see the results on a chart.
For instance, if I my friend Gary wants to see what I have posted or rated about surfing, he can type my ID under “Posted By” or “Rated By” with “Surfing” tag and see the results both on a chart and a sortable list.
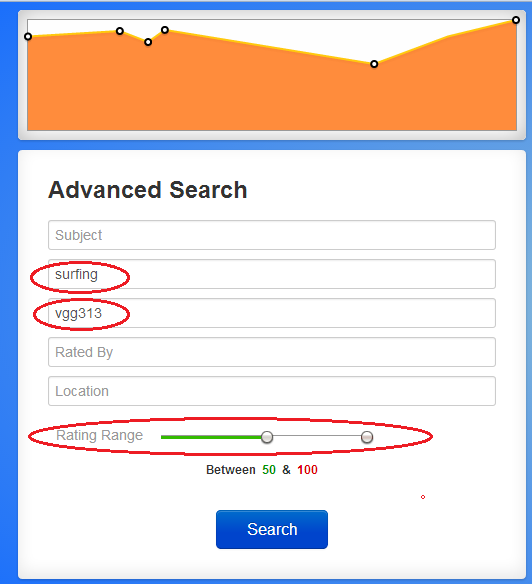
I can also limit the search results by adjusting the rating bar to filter posts with certain rating like above.
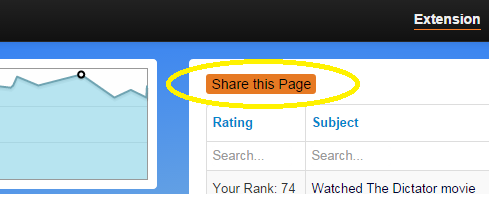
Share search results and chart with public or friends
You can share the search result page and the charts with public through the orange “Share this page” button.
Share on Facebook
By checking the Facebook checkbox with any post you can share your post on Facebook through SensoReport.com. At this point your rating will not show up on your Facebook wall. (Unless you link your Twitter to Facebook and post on your FB wall through your Twitter account)
Share on twitter
By checking the Twitter checkbox with any post you can share your post on Twitter through SensoReport and your rating will show up on your Twitter feed.
Android app & iOS apps
In progress. Simplified android version is on Google play